
MACD Simplified: Momentum & Trend Explained
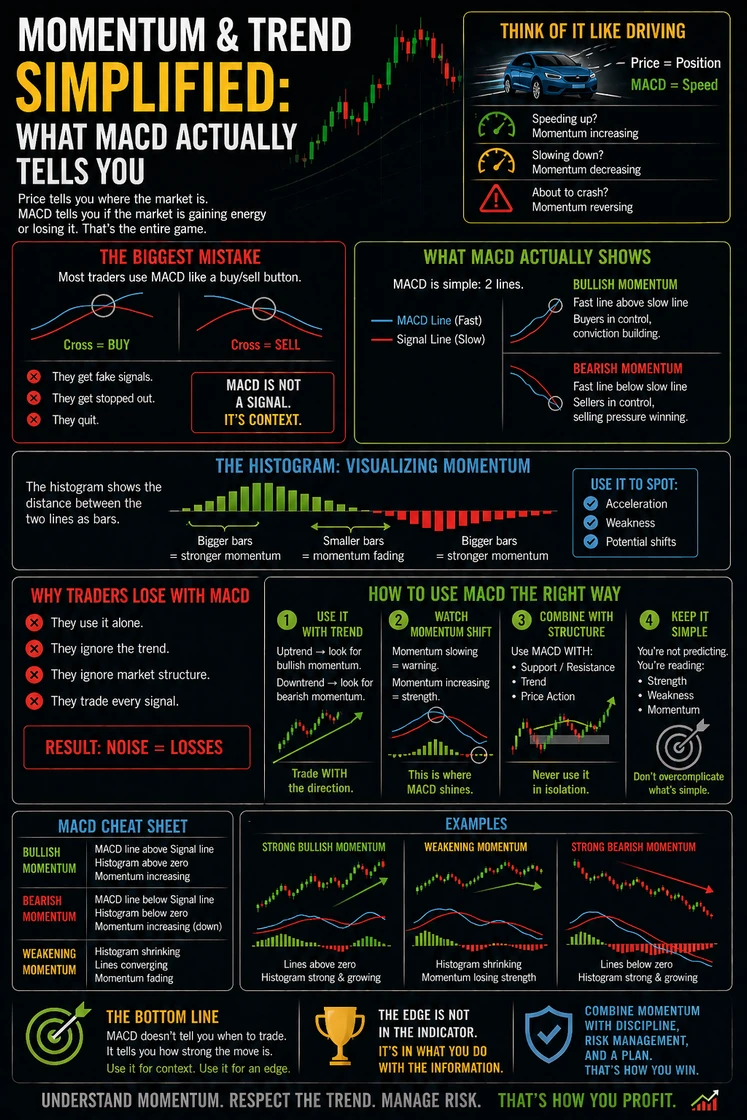
Price tells you where the market is.
👉 MACD tells you what the market is doing
Think of it like this:
🚗 Price = position ⚡ MACD = speed
👉 Is the market accelerating? 👉 Slowing down? 👉 Losing strength?
That’s what MACD shows you.
⚠️ The Biggest Mistake
Most traders use MACD like this:
👉 Cross = BUY 👉 Cross = SELL
❌ Wrong.
That’s why they:
Get fake signals Get stopped out Quit too early
👉 MACD is NOT a signal tool
👉 It’s a context tool
🧠 What MACD REALLY Shows
MACD is simple:
👉 2 lines
Fast line Slow line 📈 When Fast > Slow
👉 Momentum is bullish 👉 Buyers are in control
📉 When Fast < Slow
👉 Momentum is bearish 👉 Sellers dominate
👉 That’s the core idea
🔥 What About the Histogram?
The bars show:
👉 The distance between the lines
Bigger bars → stronger momentum Smaller bars → momentum fading
👉 This helps you spot:
Acceleration Weakness Potential shifts ❌ Why Traders Lose With MACD
They:
Use it alone Ignore trend Ignore structure Trade every signal
👉 Result:
Noise → losses
✅ How to Use MACD PROPERLY 1. Use It With Trend Uptrend → look for bullish momentum Downtrend → look for bearish momentum
👉 Trade WITH direction
2. Watch Momentum Shift Momentum slowing = warning Momentum increasing = strength
👉 This is where MACD shines
3. Combine With Structure
Use MACD WITH:
Support / Resistance Trend Price action
👉 Never alone
4. Keep It Simple
👉 Don’t overcomplicate it
You’re just reading:
Strength Weakness ⚓ Final Truth
MACD doesn’t tell you when to trade It tells you how strong the move is
🔥 The edge is not in the indicator…
👉 It’s in understanding what it’s telling you