
The RSI Trap: Why “Overbought” Doesn't Mean Sell
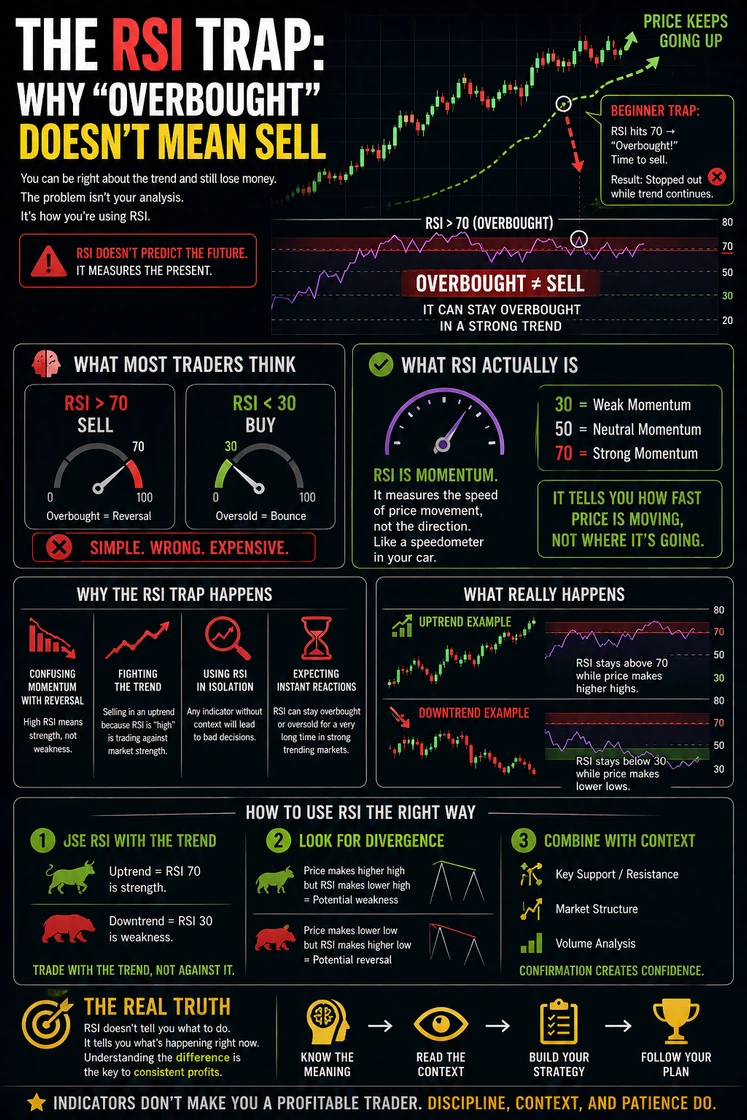
Every trader remembers that moment:
👉 You were right about the trend… ❌ But you still lost money
That’s when you realize:
👉 Being right ≠ being profitable
For many traders, this moment comes with one indicator:
👉 RSI (Relative Strength Index)
⚠️ The Beginner Mistake
Most people learn RSI like this:
RSI > 70 → SELL RSI < 30 → BUY
👉 Sounds simple… 👉 Completely wrong in practice
🧠 What RSI REALLY Is
RSI is NOT a signal.
👉 It’s a momentum indicator
Think of it like a speedometer:
30 = slow momentum 70 = strong momentum
👉 It tells you how fast price is moving ❌ Not where it’s going
🚨 The RSI Trap
Here’s where traders get destroyed:
👉 Price is trending up 👉 RSI hits 70
Beginner reaction:
👉 “Overbought → SELL”
Result:
📈 Price keeps going up 💥 You get stopped out
👉 You were right about the trend… but wrong about the timing
🔥 The Truth About RSI
👉 Overbought ≠ reversal 👉 Oversold ≠ bounce
In strong trends:
RSI can stay overbought for a LONG time RSI can stay oversold during crashes
👉 That’s strength, not a signal to exit
✅ How to Use RSI PROPERLY 1. Use RSI WITH Trend Uptrend → RSI 70 = strength Downtrend → RSI 30 = weakness
👉 Trade WITH it, not against it
2. Look for Divergence (Advanced) Price up, RSI down → potential weakness Price down, RSI up → potential reversal
👉 This is where RSI becomes powerful
3. Combine with Structure
Never use RSI alone.
Add:
Support / Resistance Market structure Volume
👉 Indicators confirm… they don’t decide
⚓ Final Truth
RSI doesn’t predict the future It measures the present
🔥 The traders who win don’t react to indicators…
👉 They understand what they mean