
What's Actually Happening Inside Chart Patterns
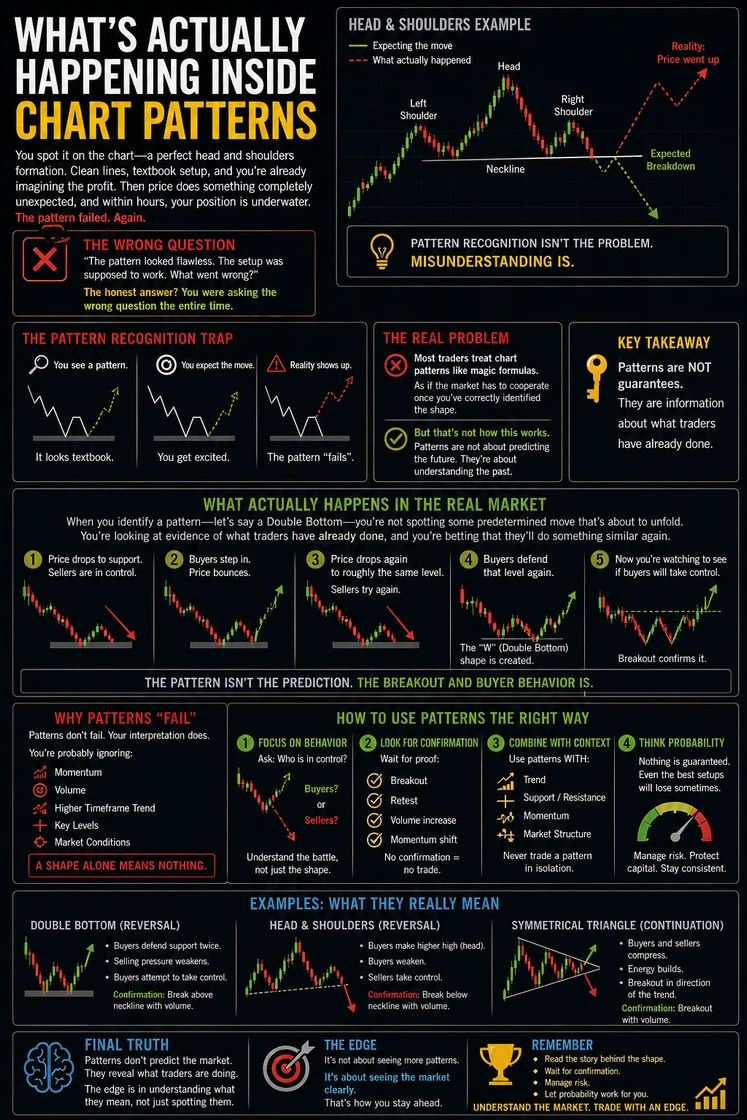
ou see it…
👉 Perfect head & shoulders 👉 Clean double bottom 👉 Textbook triangle
You think:
👉 “This is the trade”
Then price does the opposite.
💥 Loss 💥 Confusion 💥 Frustration
👉 “The pattern was perfect… what went wrong?”
⚠️ The Real Problem
You asked the wrong question.
It’s NOT:
👉 “Is this pattern valid?”
👉 It’s:
“What is actually happening behind this pattern?”
🧠 The Pattern Trap
Most traders think:
👉 Patterns = signals 👉 Patterns = guarantees
❌ Wrong.
👉 Patterns are NOT instructions
👉 They are information
🔍 What a Pattern REALLY Is
A pattern is just:
👉 A visual story of buyer vs seller behavior
Example: Double Bottom
1️⃣ Price drops → sellers in control 2️⃣ Buyers step in → bounce 3️⃣ Price drops again → sellers try again 4️⃣ Buyers defend → potential shift
👉 That’s what you’re seeing
💥 Why Patterns “Fail”
Patterns don’t fail.
👉 Your interpretation does.
Because you ignore:
Momentum Volume Context Market conditions
👉 A shape alone means nothing
❌ The Biggest Mistake
You see the pattern…
👉 And you predict the outcome
Professionals do the opposite:
👉 They wait for confirmation
✅ How to Use Patterns PROPERLY 1. Focus on Behavior
Ask:
👉 Who is in control?
Buyers? Sellers? 2. Look for Confirmation Breakout Retest Volume increase
👉 No confirmation = no trade
3. Combine With Context
Use patterns WITH:
Trend Support / Resistance Momentum
👉 Never alone
4. Think Probability
👉 Not certainty
No setup is guaranteed
⚓ Final Truth
Patterns don’t predict the market They reveal what traders are doing
🔥 The edge is not in spotting patterns…
👉 It’s in understanding what they mean